Data Accuracy
Clicking on the “Data Accuracy” tab will bring forward the Data accuracy analysis pane, see Figure 1. Given a node and a set of cases, this pane generates an analysis report with information about how well the predictions of the network match the cases.
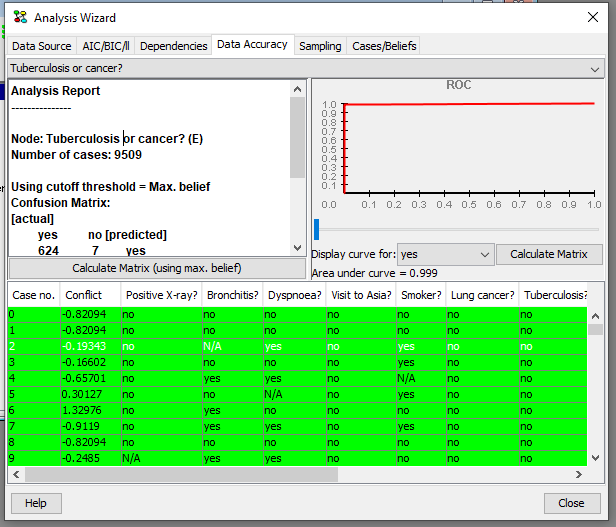
Figure 1: Data Accuracy pane.
This pane consists of four elements, a drop down box at the top to select what node to analyze, an ROC curve, an analysis report and a table showing the cases.
Analysis Report
The analysis report list the number of cases used for analysis (only cases without observations of the actual node is ignored). A confusion matrix is generated showing how well the observed states match the predicted. Prediction may be based on selecting the state with the highest belief to be the predicted state, or based on selecting a state with a belief greater than or equal to the ROC cutoff threshold (Note that if a node has two or more states that qualify to be the predicted state, one of them is randomly selected as the predicted state). An error rate is calulated telling how many cases actually match the predictions. The button Calculate Matrix (using max. belief) makes a report where prediction is based on selecting the state with the highest belief as the predicted state. Average euclidian distance and Kulbach-Leibler divergence are reported. The distance measures are from the true distribution x inferred from the case data e with respect to the selected node X, and the distribution y resulting from propagating eX.
The Euclidian distance is computed as:
The Kulbach-Leibler divergence is computed as:
The reported distance measure is averaged over all cases where X has been observed.
ROC Curve
The ROC curve lets you inspect the performance of a given variable as a classifier for the data set. X-axis is the false positive rate, and the Y-axis is the true positive rate. The ROC curve may be based on the accumulated performance for predicting all states (multi-class), or a specific state. The area under the can be used as a measure for the “goodness” of the network as a classifier for the given variable. The button Calculate Matrix makes a report where prediction is based on selecting a state with a belief greater than or equal to the ROC cutoff threshold as the predicted. The threshold can be specified by moving the threshold slider left and right. The current threshold is also signified by a point on the curve, signifying the expected performance with regards to the ratio between true and false predictions.
Case table
The table shows the cases used for analysis. The node selected for analysis will always be located in the second last column of the table. The last column in the table report the probability of the node being in the state observed in the case, given the case without information about the state of the node itself. Cases are colored green for a match, red for no match and blue if ignored. A match is when the predicted state for the node is the same state observed in the case.