Joint Probability Distribution
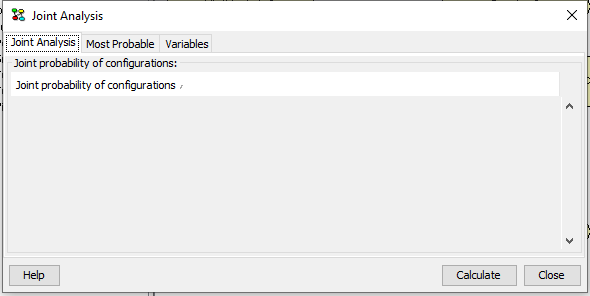
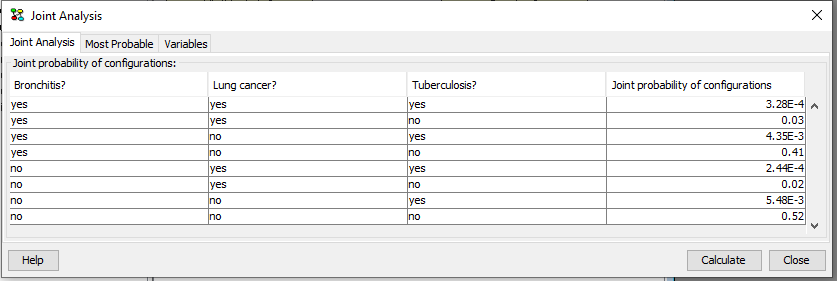
Figure 1 shows the joint analysis pane appearing after activating the joint configurations dialog. In this pane the joint probability distribution over a set of nodes is shown (Figure 3). The set of nodes in the joint can be defined by selecting the “Variables” tab (Figure 2).

Figure 1: No joint distribution has been computed.
A joint probability distribution is computed over a set of nodes. The set of nodes can be selected as indicated in Figure 2.

Figure 2: Selecting the set of nodes in the joint distribution.
Selecting nodes to appear in the joint proceeds in the same way as selecting Target(s) of Instantiations in the d-Separation pane.
After selecting the set of nodes their joint probability distribution is computed by selecting Calculate. The results for the example are shown below in Figure 3 where the probabilities are sorted.

Figure 3: The joint distribution over the selected set of nodes.
The joint probability distribution over a set of nodes is computed by message passing in a junction tree. The feasibility of computing a joint distribution is in part determined by the size of the junction tree and the combined state space size of the nodes in the joint. The size of the joint distribution is equal to the product of the state space sizes of the nodes in the jiont. Thus, the size of the joint distribution grows exponentially with the number of nodes in the joint.
Notice that the most probable configurations can be identified by sorting the rightmost column. This do, however, require that the full joint is computed. Alternatively, the most probable configurations of a subset of nodes can be identified using the Most probable tab.

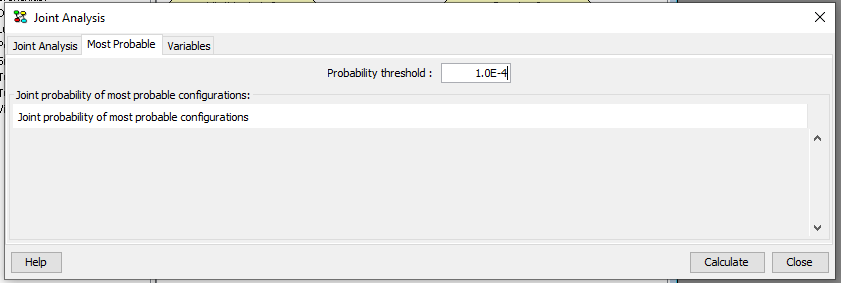
Figure 4: The most probable configurations over the selected set of nodes with a probability higher than the threshold.
This dialog can be used to identify the most probable configurations over a set of nodes when their joint is too large to be represented in main memory or if the joint cannot be computed. The user is asked to supply a threshold on the probability of the configurations to be included in the result. The lower the thredhold is, the longer the algorithm has to run.
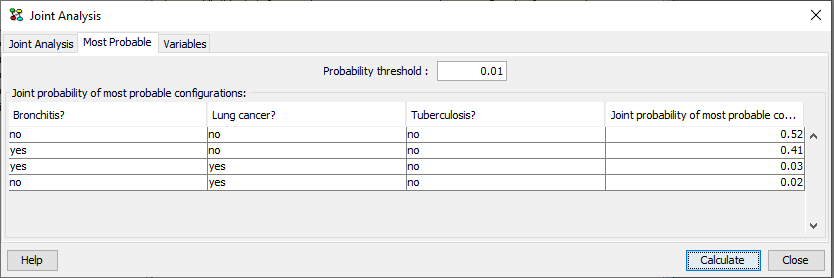
The result for the example above with a threshold of 0.01 is shown below.

Figure 5: The most probable configurations with a probability higher than the defined threshold.
This method is not supported for networks with decisions.
