What is Data Conflict Analysis?
Conflict analysis is the activity of detecting, tracing, and explaining possible conflicts among observations of variable values (i.e., evidence or data). Inconsistencies among observations are easily detected (P(evidence) = 0), but also flawed findings should be detected and traced. For example, in a diagnostic situation a single flawed test result may take the investigation in a completely wrong direction. To understand what conflict analysis is and how it can be used, there are several issues of interest: * Definition of Data Conflict: How do we define data conflict? * Conflict Measure: How do we define an appropriate measure of data conflict? * Conflict Resolution: How do we distinguish between a conflict and a rare case? * Tracing Conflicts: How do we identify the pieces of evidence that contribute to a data conflict? * Hypothesis Variables: What set of uninstantiated variables should be considered when searching for a hypothesis or observation that may eliminate the current conflict? * Partial Conflicts: How * Individual Conflicts: How does each piece of evidence impact a given hypothesis? * Hypothesis Driven Conflict Analysis: How does each piece of evidence impact a given hypothesis?
Definition of Data Conflict
We define two sets of observations e1 and e2 to be in a possible conflict with one another if they are negatively correlated.
For positively correlated findings we expect that P(e1`|e:sub:`2) > P(e1) and vice versa (i.e., observing e2 makes it more likely to also observe e1 (and vice versa)). In other words, we expect that
if e1 and e2 are positively correlated,
if e1 and e2 are negatively correlated, and
if e1 and e2 are independent.
Conflict Measure
Therefore, given a set of observations (evidence), e = {e1,…,en}, we define the conflict measure for e as
If conf(e) is positive, e1,…,en are negatively correlated, indicating a possible conflict among these pieces of evidence. (The choice of base for the log function is immaterial.)
Notice, that if conf(e) is negative (i.e., no apparent conflict among e1,…,en), then this gives you no guarantee that all of e1,…,en are positively correlated. It may well happen that there is a local conflict (i.e., that conf(e’) > 0 for a proper subset e’ of e) although conf(e) < 0.
For more information about detection of local conflict, see the help page of the junction tree panel.
Conflict Resolution
There are situations in which a positive conflict measure is computed, where there is no real conflict. These include:
Rare case: Typical data from a very rare case may indicate a possible conflict. If conf(e1,…,en) > 0 and there is a hypothesis H=h such that conf(e1,…,en,h) < 0, then h explains away the conflict. That is, if H=h is the correct hypothesis (e.g., a diagnosis) in the current situation, then there is no conflict.
Missing observation: Basically the same situation, where conf(e1,…,en) > 0 but conf(e1,…,en,I=i) < 0, where I=i is a missing piece of information. That is, there is a local conflict among e1,…,en, but the observation I=i explains the conflict.
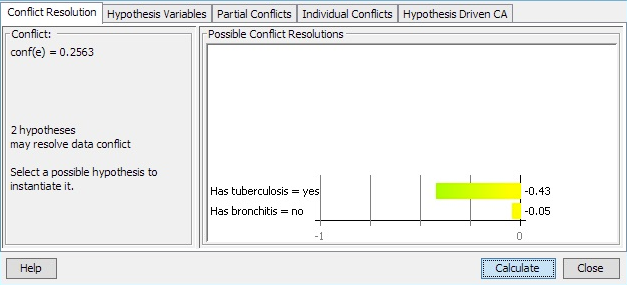
By activating the button with the  symbol, one can obtain a list of possible instantiations of currently uninstantiated variables that can eliminate the current conflict. An example of the dialog box that appears when this button is activated is shown in Figure 5.

Figure 5: Conflict resolutions dialog box. The box contains a list of possible instantiations of currently uninstantiated variables that can eliminate the current conflict.
The dialog box contains a list of possible instantiations in the form
- ::
<CM>:<variable>=<value>
where <CM> is the new conflict measure obtained if <variable> is instantiated to <value>. Only instantiations (if any) with a resulting conflict measure less than or equal to 0 get displayed.
The Instantiate button enters the currently selected instantiation (if any) as evidence.
Tracing Conflicts
Whenever a positive conflict has been observed that cannot be explained as a rare case, it is important to pinpoint the piece (or pieces) of evidence that is in conflict with the majority of the pieces of evidence
Basically, this involves computation of conflict measures for subsets of the evidence. The junction tree is useful for this purpose; see the help page for the junction tree panel for more information.
Hypothesis Variables
When searching for a hypothesis or observation that may eliminate the current conflict it may be desirable to restrict the set of uninstantiated variables considered in the search. This is done by selecting a set of hypothesis variables. Any subset of discrete chance nodes may be selected as hypothesis variables. Only the selected set of hypothesis variables are considered in the search for instantiations that may eliminate the current conflict.
Partial Conflict Analysis
To support tracing the source of a conflict or to identify conflict in a subset of the evidence, partial conflict analysis is possible. Here the partial conflicts for subsets of the evdience are computed. This is useful to trace the source of a conflict in the overall entered and propagated evidence. To reduce the computational burden it is possible to define an upper limit on the size of the subsets considered.
Individual Conflict Analysis
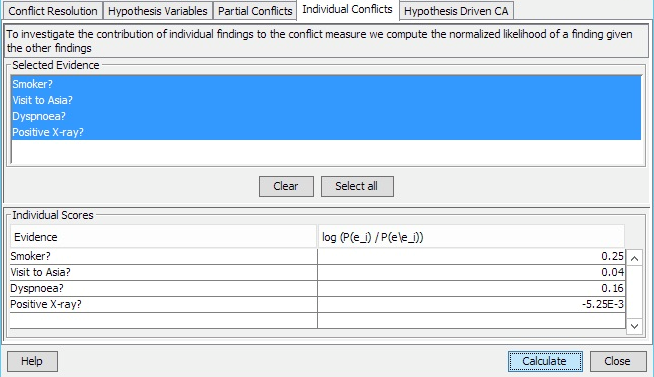
This functionality is useful to investigate the contribution of each individual finding to the overall conflict in the evidence. To assess the contribution of each finding to the conflict we compute the normalized likelihood of that finding given the other findings in the evidence.

The figure above shows an example where the conflict measure for the entire set of evidence is 0.2511. Using individual conflicts it is possible to identify Smoker? as the finding that has the highest contribution to the evidence and Dyspnoea? as the second highest contribution to the evidence as measured by the normalized likelihood.
Hypothesis Driven Conflict Analysis
So far we have considered data conflict analysis, i.e. how to identify, resolve, or explain a possible conflict in data. In hypothesis driven data conflict analysis we investigate how each piece of evidence impacts a given hypothesis.
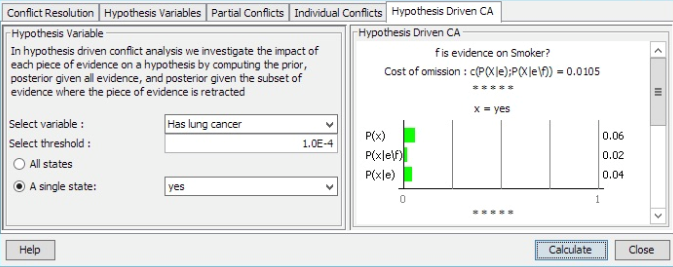
In hypothesis driven conflict analysis we investigate the impact of each piece of evidence on a given hypothesis. For each piece of evidence (finding) f we compute the prior P(h) of the hypothesis, the posterior P(h|e) of the hypothesis given the entire set of evidence e and the posterior P(h|ef) of the hypothesis given the subset of evidence where the piece of evidence f under consideration is retracted.

Hypothesis driven conflict analysis allows the user to investigate how a single piece of finding impacts the probability of the hypothesis.
A threshold value is applied to reduce the number of findings considered. Only results for findings where the cost-of-omission is above the threshold are displayed where cost-of-omission is a measure of the distance between P(H|e) and P(H|e\f).
