Parameter Sensitivity Analysis
Parameter Sensitivity analysis is the analysis of how sensitive the results of a belief update (propagation of evidence) is to variations of the value of a parameter of the model. The parameters of a model are the entries of the conditional probability distributions.
Parameter Sensitivity Analysis
The Parameter Sensitivity panel allows us to perform sensitivity analysis on the hypothesis variable to changes on the value of the parameter variable. The sensitivity analysis is based on the sensitivity function:
for computing the belief of a state of a node for a given CPT value of a parameter. The sensitivity value is computed based on the function
In the following example (Figure 1.) the “asia.net” network is loaded and compiled before entering the Parameter Sensitivity Panel (available from the “Wizards” menu in Run-mode). The “Has bronchitis” node is selected as the hypothesis variable and “All States” is checked so an analysis will be performed on all states of the Hypothesis node. The node “Smoker” is selected as the parameter variable. When selecting a parameter variable its CPT table is displayed in the middle of the panel (Figure 1).
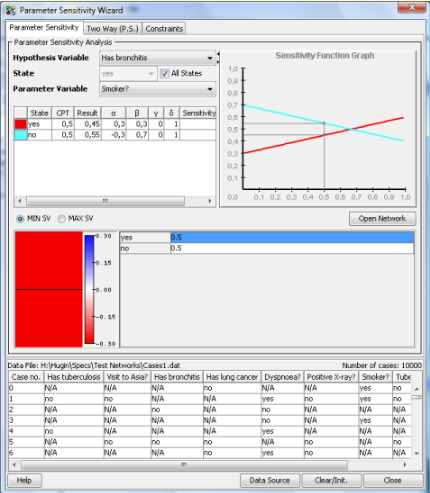
Figure 1: Parameter Sensitivity Analysis
By clicking on yes = 0.5 in the CPT table, the sensitivity function is used to compute a value (belief) for each state of the hypothesis variable. A graph is displayed on the top right corner of the panel, showing two lines that represent how sensitive the states of the hypothesis variable are, to changes of the parameter values, i.e., the entry of the CPT selected which in the example is yes = 0.5.
From this graph we notice that the state of the hypothesis variable with highest probability changes when the parameter value is above approximately 0.7. Also, notice that the sensitivity function is a straight line. Given that “Smoker = yes = 0.5” the belief that the patient has bronchitis is 0.45 and the belief that he doesn’t have bronchitis is 0.55. These points (0.5, 0.45) and (0.5, 0.55) are shown on the graph.
Sensitivity analysis can not be performed for extreme CPT values, i.e., zero and one. When the hypothesis node has many states, the graph can become confusing because of overlapping sensitivity function lines. By selecting a state in the graph information table (upper - left), only the sensitivity function line for the selected state will be displayed in the graph. To see all lines again, select a CPT index in the Parameter variable table. The table located in the middle of the panel (Figures 1a, 1b), is the CPT table of the node selected in the Parameter Variable combo. When selecting a cell in the table, sensitivity analysis is performed using the selected cpt value. The radio boxes “MIN SV” and “MAX SV” allows the user to view a color chart that represents the sensitivity values for every cpt index.
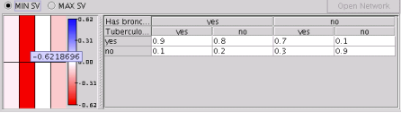
Figure 1a: CPT table of Dyspnoea with a color chart showing the minimum Sensitivity values.
When a color chart with the minimum sensitivity values is selected (Figure 1a), the darker the red color is, the lower the minimum sensitivity value is for the corresponding cpt value.
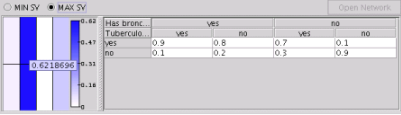
Figure 1b: CPT table of Dyspnoea with a color chart showing the maximum Sensitivity values.
When a color chart with the maximum sensitivity values is selected, the darker the blue color is, the higher the maximum sensitivity value is for the corresponding cpt value (Figure 1b).
Pointing on a cell in the color chart, displays the actual value of the MIN/MAX sensitivity value; clicking on it selects the corresponding cpt index and performs sensitivity analysis.
The “MIN SV” and “MAX SV” are only enabled when the user has selected to perform sensitivity analysis on all states because otherwise, each cpt value corresponds to one sensitivity value so a color chart showing those values is displayed.
Import a case file
It is possible to perform parameter sensitivity analysis after inserting a case stored in a case file or a set of cases stored in a data file. A case file represents a single case whereas a data files represents a number of cases for a given network. The “Data Source” button imports a file in the wizard and gives the user the possibility to select cases and enter them as evidence in the domain. Sensitivity analysis can now be performed for each case in the file. In Figure 2, a case file “asia-cases” is imported and displayed as a table. When clicking on a case, it is entered as evidence in the domain and after performing sensitivity analysis as shown above (Figure 1), the sensitivity values calculated and the lines in the graph, are different because the new evidence is taken in to consideration.
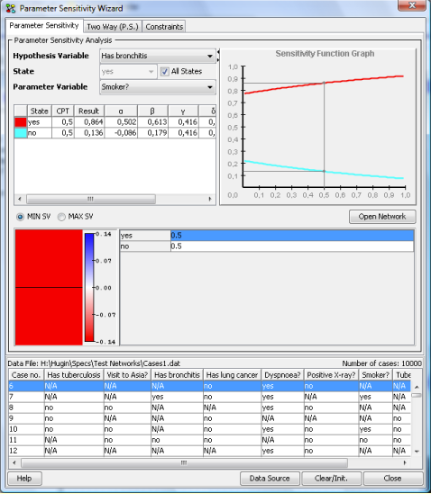
Figure 2: Sensitivity analysis with evidence from a case file.
Sensitivity analysis can not be performed on a hypothesis node with evidence entered. To avoid error messages, the node names of nodes with evidence are marked with (e) in the Hypothesis Variable Combo. (Figure 2a)
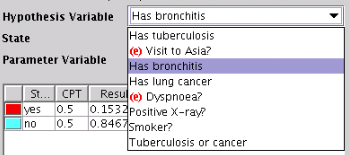
Figure 2a: Hypothesis Variable Combo
Accross cases
When cases are loaded in the wizard, it is possible to perform parameter sensitivity analysis across many cases. Selecting all (Ctrl-A) or some cases in the cases table (Figure 2b) and then computing the sensitivity for the selected hypothesis and parameter, will generate a table in the information panel that displays the results for all cases. Each row in the table shows the results of the parameter sensitivity analysis for the selected state of the hypothesis, in each case. It is not possible to compute sensitivity for all states of the hypothesis accross cases. No results are shown for cases where the computation has failed (fx. when evidence is entered in the hypothesis).
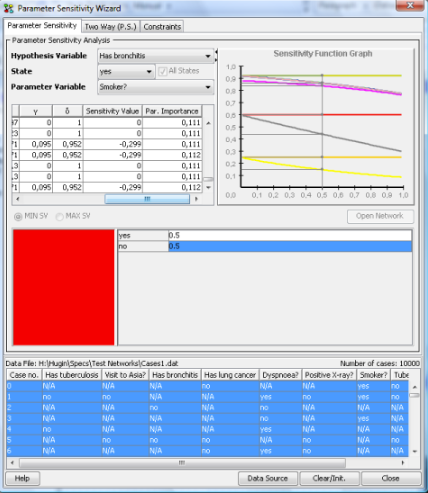
Figure 2b: Sensitivity computed accross cases.
The information table in addition to the Sensitivity Value, also displays the Parameter Importance value as it adjusts through every case. The parameter importance value at the last row is the final one computed after going through all cases.
Selecting a row in the info table will show the Sensitivity function graph for the selected case.
Open Network
The “Sensitivity Set Graph Panel” is a tool to help visually capture the results of the parameter sensitivity analysis, directly on the network. It is accessibly by pressing the “Open Network” button in the “Parameter Sensitivity Panel”. Every node is divided in three parts and every part is painted in a different colour. Starting from the left of a node, the colours used are blue, red and green which represent different values.
The blue colour (left) represents the maximum sensitivity value.
The red colour (center) represents the minimum (negative) sensitivity value.
The green colour (right) represents the average sensitivity value.
The tone of each colour indicates how high the value they represent is. In case of the maximum and average sensitivity values (blue, green), the higher the number is, the darker the colour becomes. In case of the minimum (red) value the opposite applies. If a value is 0, the colour gets toned down to white. The yellow colour indicates that it was not possible to compute sensitivity values for that node, either because the propagation failed (because of inconsistent evidence or evidence is entered in the hypothesis) or because the values in the node’s CPT table are 0 and 1.
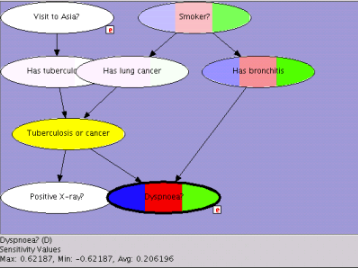
Figure 3: Sensitivity set graph
Figure 3 shows an example of the “asia” network. In this example, it is immediately visible which nodes have the highest values and which have values 0 or close to 0. By pointing on the “Dyspnoea” node, the node’s minimum, maximum and average values are displayed at the bottom of the panel together with its name and label. Selecting a node on the network will set it as the parameter variable in the “Parameter Sensitivity Panel”.