Data Sequences in HUGIN
Since HUGIN version 8.3 the data frame HUGIN has had support for data in sequences (or time series). When the associated runtime domain is a DBN-model HUGIN already assumes that the Data set is a sequence of observations. However, if the data file contains multiple sequences then each sequence must have a sequence id (SID). The SID is a column in the data set with with text identifiers that are the same for all observations belonging to the same sequence. For SIDs you must be aware of the following properties:
All observations belonging to the same sequence must be organized in sequence in the data set. As soon as a new SID is observed, it HUGIN assumes that a new sequence begins.
SIDs are not required to be unique throughout the data set. If two sequences share a SID they will be treated as different sequences.
The use of a Sequence Identifier has impact on how many things work throughout the data frame. Here is a list of some of the functions it influences:
Data Propagation: In batch propagation mode, HUGIN resets the time window back to 0 and reinitializes the domain each time a SID is not similar to the SID of the previous case.
Transform to time slices: Transformation of a dataset into time slices transforms sequence by sequence in stead of entire data set.
Transform data sequences to cases for learning: Possibility to transform a set of sequences into a dataset containing one row for each sequence. The number of columns will be the number of cases in the longest sequence times the original number of columns.
Get ready
By following these links you can read how to:
Pointing out the SID column
To point out the SID column in a data set with multiple sequences right click on the column containing the sequence identifiers (See Figure 1).
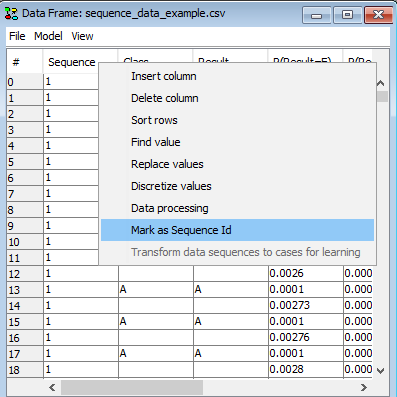
Figure 1: Right-click on the column and select “Mark as Sequence id” to mark a column as SID.
Once the SID column has been pointed out, or whenever an new SID column is choosen a dialog box appears with statistics on the sequences found in the data set (See Figure 2).
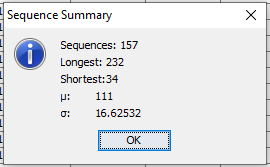
Figure 2: Once a new SID has been selected, a dialog appears with some statistics on the observed sequences.
Once the SID column obtains a “[sid]” tag which indicates that the column is the SID (See Figure 3). The data set can be saved with the SID choosen and once it is re-loaded HUGIN will read the tag and know that it is the SID.
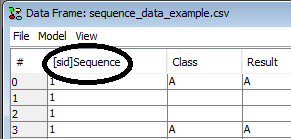
Figure 3: The appended “[sid]” tag on the column name tells HUGIN that the column is the SID.
Transform Sequences to cases for learning
Once the SID column has been pointed out, the option “Transform dataset to cases for learning” becomes available (See Figure 3). This option transforms the dataset into a new dataset in which each sequence is represented as individual cases. The number of columns will correspond to the original number of columns times the number of observations in the longest sequence.
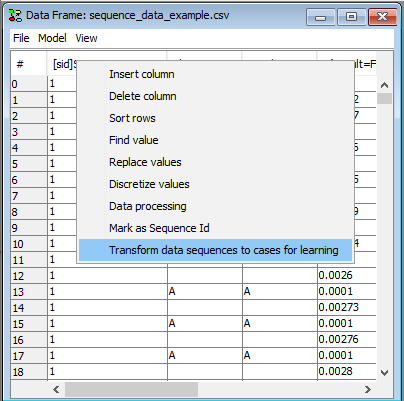
Figure 4: As soon as a column has a “[sid]” tag it is possible to transform the dataset to a dataset containing a row for each sequence.
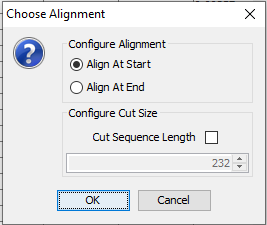
Figure 5: Choose whether to align the data to the right or to the left and whether to cut away columns with lowest or highest time label respectively.
The transformed dataset opens in a new data frame (See Figure 6). The data set can now be inspected, propagated or saved and opened using the Learning Wizard.
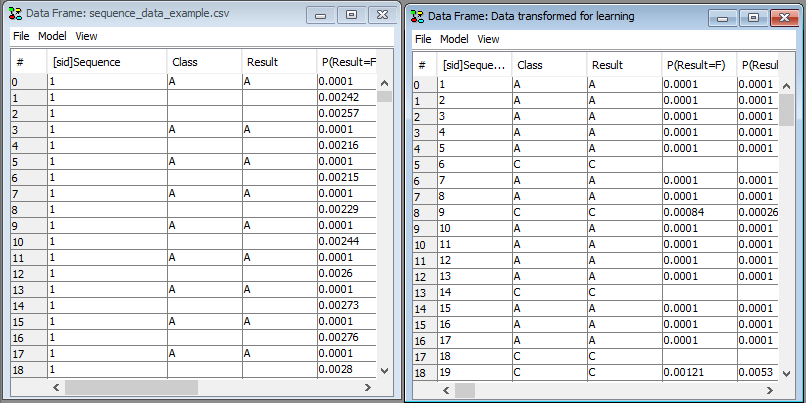
Figure 6: The transforme dataset will open in a new frame.
Classifier Performance on Sequences
With a SID column, the Classifier Performance tool has been extended with ability to evaluate classification of sequences. In this tool, sequences are assumed to appear in sequence and not as individual cases as above. The Classifier Performance tool is accessed by right-clicking on a cell in the data matrix and then selecting “Classifier Performance”.
In the “Multistate Classifiers” tab notice that the “Configure Sequences” button is now visible. It becomes visible when a SID column is selected on the dataset (See Figure 7).
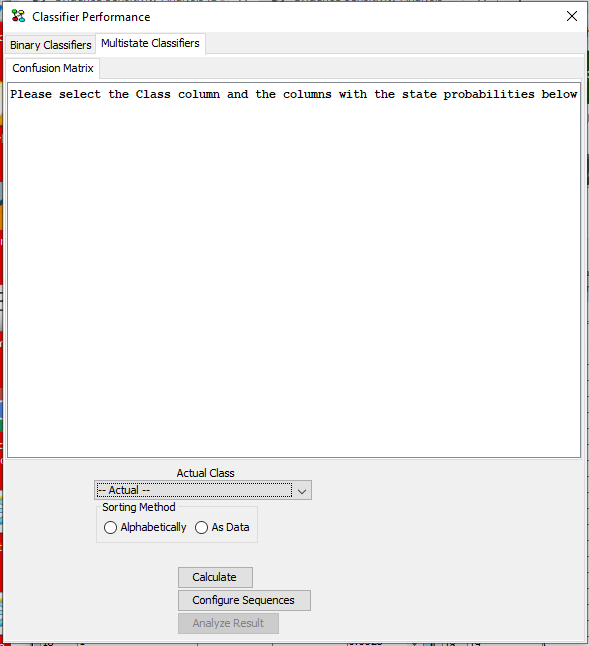
Figure 7: In the Classifier Performance tool, Multistate Classifiers tab, the “Configure Sequences” button is visible when operating with data sequences.
Under “Actual Class” select the column containing the actual class in the data set (See Figure 8). As soon as a column is selected HUGIN tries to “guess” the columns containing the probabilities of each states. HUGIN’s guess can be reviewed and modified in the “Columns with State probabilities” panel. The guess is based on a penalizing algorithm that assigns lowest penalty to columns with names matching “P([.]?=StateName from Actual Class)”, where [.]? is any pattern containing at least 1 character. Arbitrary text can be appended, but it will increase the penalty.
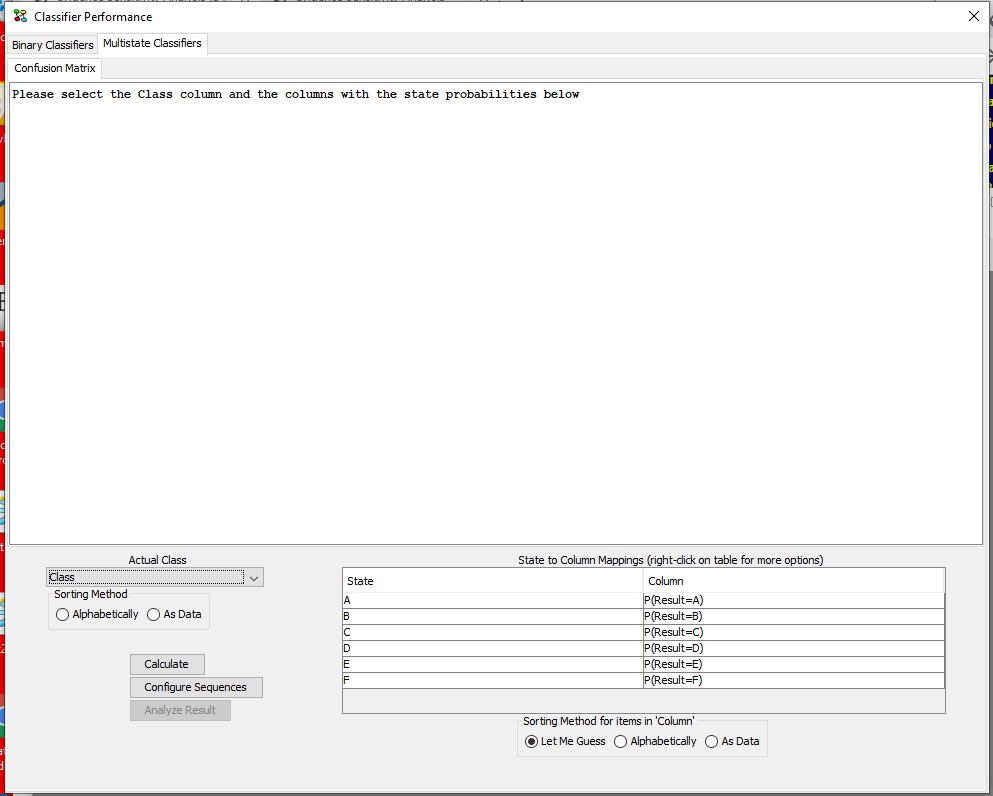
Figure 8: When a class has been selected, HUGIN attempts to auto fill out the columns in “Columns with state probabilities”.
The classification evaluation method can be configured under “Configure Sequences”. Here there are 2 options:
Use Threshold: Classification mode that assigns the sequence to a class as soon as the probability of one class anywhere in the sequence is above a selected threshold (See Figure 9).
Use Last Case: Classification mode that considers the state probabilities of the last case in the sequence only (See Figure 10).
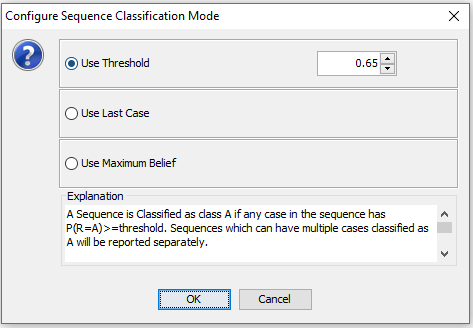
Figure 9: The transforme dataset will open in a new frame.
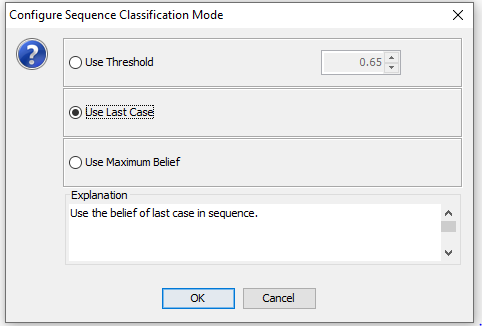
Figure 10: The transforme dataset will open in a new frame.
Click on “Calculate” to calculate the result. The text in the frame explains what the evaluation has counted. Notice that you may need to scroll in order to read all results and be aware that not all data may be included in the confusion matrix. The latter is due the the possibility of a sequence belonging to multiple classes. Such cases are summed up in the results below the confusion matrix.
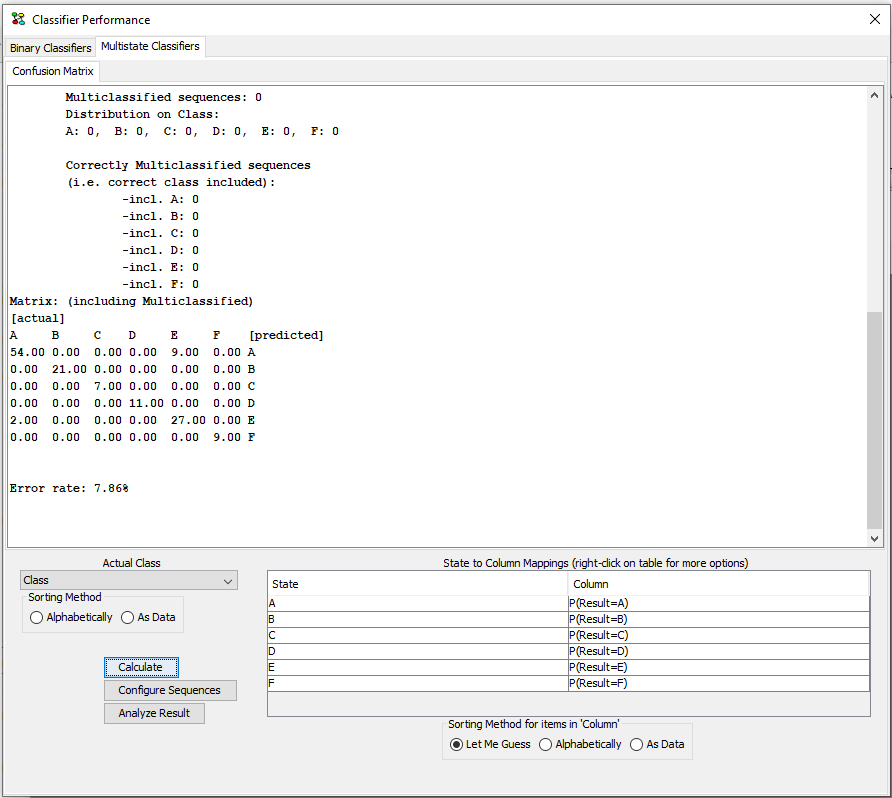
Figure 11: The transforme dataset will open in a new frame.
A click on the button “Analyze Result” will open a new dataframe containing the data used for the construction of the confusion matrix and the count of multi-classifications. This dataset is opened in a new frame. It contains the following columns:
Sequence id
Sequence index in original data set
Sequence’s true class
List of classes the particular sequence was assigned to
For each class C, the relative index in the sequence where the sequence was recognezed as belonging to C.