Introduction to Bayesian Network
A Bayesian network (BN) is used to model a domain containing uncertainty in some manner. This uncertainty can be due to imperfect understanding of the domain, incomplete knowledge of the state of the domain at the time where a given task is to be performed, randomness in the mechanisms governing the behavior of the domain, or a combination of these.
Bayesian networks are also called belief networks and Bayesian belief networks. Previously, the term causal probabilistic networks has also been used. A BN is a network of nodes connected by directed links with a probability function attached to each node. The network (or graph) of a BN is a directed acyclic graph (DAG), i.e., there is no directed path starting and ending at the same node.
A node represents either a discrete random variable with a finite number of states or a continuous (Gaussian distributed) random variable. Throughout this document, the terms “variable” and “node” are used interchangeably. The links between the nodes represent (causal) relationships between the nodes.
If a node doesn’t have any parents (i.e., no links pointing towards it), the node will contain a marginal probability table. If the node is discrete, it contains a probability distribution over the states of the variable that it represents. If the node is continuous, it contains a Gaussian density function (given through mean and variance parameters) for the random variable it represents.
If a node do have parents (i.e., one or more links pointing towards it), the node contains a conditional probability table (CPT). If the node is discrete, each cell in the CPT (or, in more general terms, the conditional probability function (CPF)) of a node contains a conditional probability for the node being in a specific state given a specific configuration of the states of its parents. Thus, the number of cells in a CPT for a discrete node equals the product of the number of possible states for the node and the product of the number of possible states for the parent nodes. If the node is continuous, the CPT contains a mean and a variance parameter for each configuration of the states of its discrete parents (one if there are no discrete parents) and a regression coefficient for each continuous parent for each configuration of the states of the discrete parents.
The following example tries to make all this more concrete.
The Apple Tree Example
The problem domain of this example is a small orchard belonging to Jack Fletcher (let’s call him Apple Jack). One day Apple Jack discovers that his finest apple tree is losing its leaves. Now, he wants to know why this is happening. He knows that if the tree is dry (caused by a drought) there is no mystery - it is very common for trees to lose their leaves during a drought. On the other hand the losing of leaves can be an indication of a disease.
The situation can be modeled by the BN in Figure 1. The BN consists of three nodes: Sick, Dry, and Loses which can all be in one of two states: Sick can be either “sick” or “not” - Dry can be either “dry” or “not” - and Loses can be either “yes” or “no”. The node Sick tells us that the apple tree is sick by being in state “sick”. Otherwise, it will be in state “not”. The nodes Dry and Loses tell us in the same way if the tree is dry and if the tree is losing its leaves, respectively.
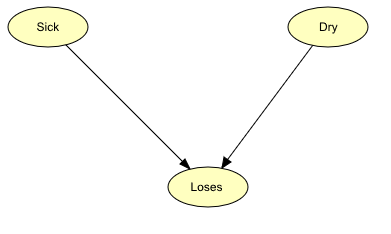
Figure 1: BN representing the domain of the Apple Jack problem.
The BN in Figure 1 models the causal dependence from Sick to Loses and from Dry to Loses. This is represented by the two links.
When there is a causal dependence from a node A to another node B, we expect that when A is in a certain state this has an impact on the state of B. One should be careful when modeling the causal dependences in a BN. Sometimes it is not quite obvious in which direction a link should point. In our example, for instance, we say that there is a causal link from Sick to Loses because when a tree is sick this might cause the tree to lose its leaves. But couldn’t one say that when the tree loses its leaves it might be sick and then turn the link in the other direction? No, we cannot! It is the sickness that causes the lost leaves and not the lost leaves that cause the sickness.
In Figure 1, we have the graphical representation of the BN. However, this is only what we call the qualitative representation of the BN. Before we can call it a BN, we need to specify the quantitative representation.
The quantitative representation of a BN is the set of CPTs of the nodes. Tables 1, 2, and 3 show the CPTs of the three nodes in the BN of Figure 1.
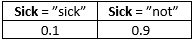
Tabel 1: P(Sick)
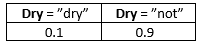
Tabel 2: P(Dry)
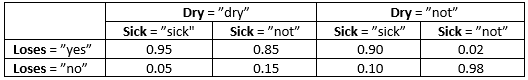
Tabel 3: P(Loses | Sick, Dry)
Note that all three tables show the probability of a node being in a specific state depending on the states of its parent nodes but since Sick and Dry do not have any parent nodes, the distributions in Tables 1 and 2 are not conditioned on anything.
BNs that are concerned with the causal relations between variables at a given instance, such as the one described above, are sometimes known as Static Bayesian Networks (SBNs). SBNs are concerned only with the current situation and do not explicitly model temporal sequences, i.e. the past is ignored and the future is not predicted. For example, in Figure 2, there are two diseases (D1 and D2) which can cause different symptoms (S1 and S2). Using the information at hand on the symptoms makes it possible to predict the probabilities of each disease.
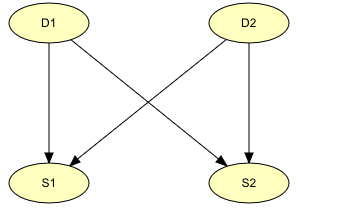
Figure 2: An example of Static Bayesian Network (SBN).
In many problem domains, such as the medical situation considered above, it is almost inconceivable to represent data and reason about them without using a temporal dimension, since things evolve through time. SBNs, like the one represented in Figure 2, can’t be used for such systems and thus the network has to be expanded to include temporal information. Such networks are known as Dynamic Bayesian Networks (DBN). The simplest way to extend an SBN into a DBN is by including multiple instances (time slices) of the SBN and linking these together. For example, the network in Figure 3 is obtained by linking multiple instances of the network in Figure 2.
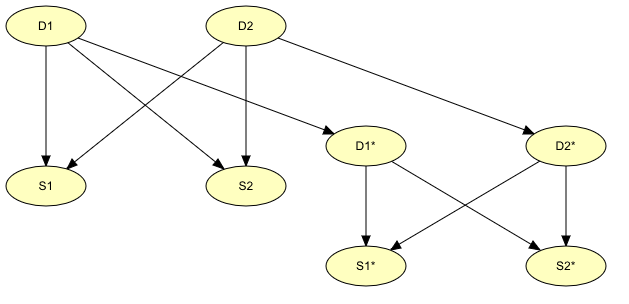
Figure 3: An example of Dynamic Bayesian Network (DBN).
The existence of a disease today will have an effect on whether or not the disease will be there tomorrow. Therefore there should be a link between the nodes representing “disease today” (nodes D1 and D2) and “disease tomorrow” (nodes D1* and D2*). Using this new network, it is possible to predict the progress of the diseases.
What was shown in the above examples is a description of how to construct very simple BNs. When we have constructed a network, we can use it for entering evidence in some of the nodes where the state is known and then retrieve the new probabilities computed in other nodes given this evidence. In the Apple Tree example, suppose we know that the tree is losing its leaves. We then enter this evidence by selecting the state “yes” in the Loses node. Then we can read the probability of the tree being sick as the probability of the node Sick being in state “sick” and the probability of the tree being dry as the probability of the node Dry being in state “dry”.
Computing the probabilities of other variables given some evidence, like the situations described above is known as Belief Updating. Another piece of information that might be interesting to find is the most likely global assignment of the states of all random variables given some evidence. This is know as Belief Revision.
HUGIN provides you with a tool to construct such networks. After constructing the BNs, you can do belief revision, belief updating, and much more. If you are in the process of learning more about the HUGIN Development Environment, now would be a good time to go through the How to Build BNs tutorial. Here, the Apple Tree BN is constructed using the HUGIN Graphical User Interface. You can also go on reading the Introduction to Object-Oriented Networks; for example, object-oriented networks are very helpful when constructing networks with repetitive structures like in the diseases network above. Or you might wish to go on reading the Introduction to Influence Diagrams (IDs); IDs are BNs extended with utility nodes and decision nodes.
Definition of Bayesian Networks
- Formally, a Bayesian network can be defined as follows:
A Bayesian network is a pair (G,P), where G=(V,E) is a directed acyclic graph (DAG) over a finite set of nodes (or vertices), V, interconnected by directed links (or edges), E, and P is a set of (conditional) probability distributions. The network has the following property:
Each node representing a variable A with parent nodes representing variables B1, B2,…, Bn (i.e., Bi, → A for each i=1,…,n) is assigned a conditional probability table (CPT) representing P(A | B1, B2, …, Bn).
The nodes represent random variables, and the links represent probabilistic dependences between variables. These dependences are quantified through a set of conditional probability tables (CPTs): Each variable is assigned a CPT of the variable given its parents. For variables without parents, this is an unconditional (also called a marginal) distribution.
Conditional Independence
An important concept for Bayesian networks is conditional independence. Two sets of variables, A and B, are said to be (conditionally) independent given a third set C of variables if when the values of the variables C are known, knowledge about the values of the variables B provides no further information about the values of the variables A:
Conditional independence can be directly read from the graph as follows: Let A, B, and C be disjoint sets of variables, then
identify the smallest sub-graph that contains \(A \cup B \cup C\) and their ancestors;
add undirected edges between nodes having a common child;
drop directions on all directed edges.
Now, if every path from a variable in A to a variable in B contains a variable in C, then A is conditionally independent of B given C (Lauritzen et al. 1990).
To illustrate this concept, let us consider the following fictitious piece of fictitious medical knowledge
“Shortness-of-breath (dyspnoea) [d] may be due to tuberculosis [t], lung cancer [l] or bronchitis [b], or none of them, or more than one of them. A recent visit to Asia [a] increases the risk of tuberculosis, while smoking [s] is known to be a risk factor for both lung cancer and bronchitis. The result of a single chest X-ray [x] does not discriminate between lung cancer and tuberculosis, neither does the presence or absence of dyspnoea” (Lauritzen & Spiegelhalter 1988).
The last fact is represented in the graph by the intermediate variable e. This variable is a logical-or of its two parents (t and l); it summarizes the presence of one or both diseases or the absence of both.
Figure 4 shows a model for the knowledge.
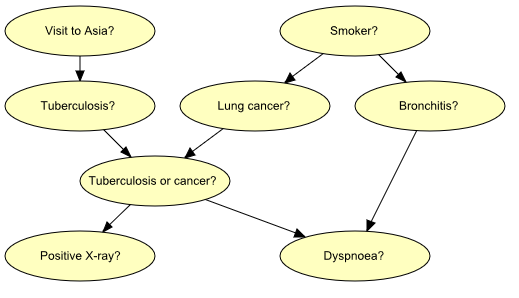
Figure 4: Graph representing structural aspects of medical knowledge concerning lung diseases.
If we learn the that a patient is a smoker, we will adjust our beliefs (increased risks) regarding lung cancer and bronchitis. However, our beliefs regarding tuberculosis are unchanged (i.e., t is conditionally independent of s given the empty set of variables). Now, suppose we get a positive X-ray result for the patient. This will affect our beliefs regarding tuberculosis and lung cancer, but not our beliefs regarding bronchitis (i.e., b is conditionally independent of x given s). However, had we also known that the patient suffers from shortness-of-breath, the X-ray result would also have affected our beliefs regarding bronchitis (i.e., b is not conditionally independent of x given s and d).
These (in)dependences can all be read from the graph of Figure 1 using the method described above.
Another, equivalent method to determine conditional independence is d-separation., due to Pearl (1988)..
Inference
Inference in a Bayesian network means computing the conditional probability for some variables given information (evidence) on other variables.
This is easy when all available evidence is on variables that are ancestors of the variable(s) of interest. But when evidence is available on a descendant of the variable(s) of interest, we have to perform inference opposite the direction of the edges. To this end, we employ Bayes’ Theorem:
HUGIN inference is essentially a clever application of Bayes’ Theorem; details can be found in the paper by Jensen et al. (1990(1))..
Networks with Conditional Gaussian Variables
The HUGIN Decision Engine is able to handle networks with both discrete and continuous random variables. The continuous random variables must have a Gaussian (also known as a normal) distribution conditional on the values of the parents.
The distribution for a continuous variable Y with discrete parents I and continuous parents Z is a (one-dimensional) Gaussian distribution conditional on the values of the parents:
Note that the mean depends linearly on the continuous parent variables and that the variance does not depend on the continuous parent variables. However, both the linear function and the variance are allowed to depend on the discrete parent variables. These restrictions ensure that exact inference is possible.
Note that discrete variables cannot have continuous parents.
Figure 5 shows a network model for a waste incinerator (Lauritzen 1992):
“The emissions (of dust and heavy metals) from a waste incinerator differ because of compositional differences in incoming waste [W]. Another important factor is the waste burning regimen [B], which can be monitored by measuring the concentration of CO2 in the emissions [C]. The filter efficiency [E] depends on the technical state [F] of the electro filter and on the amount and composition of waste [W]. The emission of heavy metals [Mo] depends on both the concentration of metals [Mi] in the incoming waste and the emission of dust particulates [D] in general. The emission of dust [D] is monitored through measuring the penetrability of light [L].”
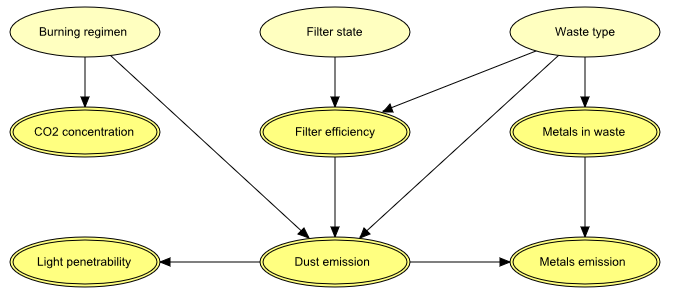
Figure 5: The structural aspects of the waste incinerator model: B, F, and W are discrete variables, while the remaining variables are continuous.
The result of inference within a network model containing conditional Gaussian variables is - as always - the beliefs (i.e., marginal distributions) of the individual variables given evidence. For a discrete variable this amounts to a probability distribution over the states of the variable. For a conditional Gaussian variable two measures are provided:
the mean and variance of the distribution;
since the distribution is in general not a simple Gaussian distribution, but a mixture (i.e., a weighted sum) of Gaussians, a list of the parameters (weight, mean, and variance) for each of the Gaussians is available.
From the network shown in Figure 5 (and given that the discrete variables B, F, and W are all binary), we see that
the distribution for C can be comprised of up to two Gaussians (one if B is instantiated);
initially (i.e., with no evidence incorporated), the distribution for E is comprised of up to four Gaussians;
if L is instantiated (and none of B, F, or W is instantiated), then the distribution for E is comprised of up to eight Gaussians.
See also the section on Gaussian distribution functions for details on how to specify a conditional Gaussian distribution function using the HUGIN Graphical User Interface.
To learn how to build a Bayesian network using the HUGIN Graphical User Interface, please consult the tutorial How to Build BNs.