Junction Tree
Inference in Bayesian networks and influence diagrams are performed in a secondary structure known as a junction tree. The junction tree for a network is generated when one switches from Edit Mode to Run Mode. The junction tree of the network can be displayed in a separate window, opened by selecting the Show Junction Tree item of the View Menu.
Figure 1 shows a junction tree for the ChestClinic network.
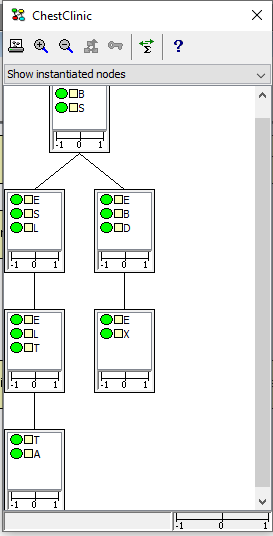
Figure 1: Junction tree for the ChestClinic network.
To understand what a junction tree is and what it can be used for, there are several issues that may be of interest:
What is a Junction Tree? What is it and how is it generated?
Inference in a Junction Tree: How is a junction tree used for inference?
Tools and Functionalities: How to use the tools and functionalities offered?
Also of interest is how one can use a junction tree to detect and trace conflicting evidence.
What is a Junction Tree?
Inference in a network is conducted through message passing in a junction-tree representation of it. The junction tree is obtained through transformation that involves the processes of moralization and triangulation. It can be shown that exact inference in a Bayesian network requires (implicit or explicit) moralization and triangulation.
In the moralization step, an undirected link is first added between each pair of unconnected parent nodes that have a common child node. Next, all directed links are converted to undirected links. This process results in a so-called moral graph.
The triangulation step adds (undirected) links to the moral graph such that the resulting graph is triangulated (or chordal). An undirected graph is chordal whenever it does not contain a cycle (i.e., a path of distinct nodes, except that the first and the last nodes are identical) of length greater than 3 without a chord (i.e., a link between non-consecutive nodes of the path). The maximal completely connected components or sub-graphs (i.e., where each pair of nodes are connected to each other) of a graph are called cliques.
It is the cliques of the triangulated graph that form the nodes of the junction tree. Each clique has associated with it a table with indices spanning the Cartesian product of the state spaces of the nodes of the clique. Thus, each clique holds a representation of a function over all nodes of the clique. That is, a joint probability distribution over the nodes of the clique can be represented in the clique table.
Obviously, as each clique has associated with it a table that grows exponentially in size as more nodes are added to it, we want the cliques to be as small as possible. However, as the number of different triangulations may be as high as n factorial, where n is the number of nodes of the network, and as the representational and computational complexities of the resulting junction trees vary heavily over the different triangulations, it can be very difficult to find an optimal triangulation. In fact, the complexity of this optimization problem is NP-hard (mathematical way to say that it is impossible within reasonable time).
The HUGIN Decision Engine (HDE) offers a number of different triangulation algorithms, most of which are based on greedy one-step look ahead heuristics. In many cases, however, an optimal (or near-optimal) triangulation can in fact be found. The HDE offers a method for (near-)optimal triangulation, which in many cases results in junction trees of much lower complexity than those generated using the other (heuristic) triangulation methods provided. For details, see the description of the compile function.
Please note that if the Bayesian network is disconnected, so is the junction tree. A disconnected junction tree is sometimes called a junction forest.
Inference in a Junction Tree
As mentioned above, inference in a network amounts to message passing in a junction-tree representation of the network.
An inference step (also referred to as a propagation) consists of two main phases:
Inward message passing in which messages are sent from the leaves of the junction tree towards a root of the tree.
Outward message passing in which messages are sent from the root of the tree towards to leaves.
A clique, C, are allowed to send a message to a neighboring clique, D, whenever C has received messages from all other neighbors and it has not already sent a message to D.
A message from a clique C to a neighboring clique D consists of a marginal table over the nodes that are members of both C and D. More precisely, the message is computed from the table of C by eliminating the dimensions corresponding to the nodes of C that are not members of D. Typically, elimination is performed through summation. To compute the most likely configuration (also known as the most probable explanation (MPE)) and the probability of this configuration, elimination is, however, performed through maximization.
Tools and Functionalities
The cliques of the junction tree(s) are displayed as rectangles (see Figure 2), where the upper part of the rectangle contains a list of the nodes that are members of the clique, and the lower part contains a conflict bar indicating the conflict measure pertaining to the evidence entered in the sub-tree rooted at the clique. For details on data conflict analysis, please consult the data conflict analysis section.

Figure 2: A clique of the ChestClinic junction tree.
A clique can be selected by clicking the left mouse button. When selected the border of a clique change from gray to black. It is possible to select multiple cliques by holding down the shift key while clicking. When selecting one or more cliques, the nodes of the selected cliques will get selected in the Network Panel.
The Junction Tree Panel offers a number of other functionalities, which are available through a tool bar of buttons and a pull-down menu (see Figure 3).
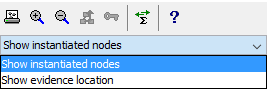
Figure 3: A clique of the Asia junction tree.
The printer button enables print out of the junction tree. The junction tree can be printed either to a printer, or to a file. Similarly to printing of the networks, it is possible to split the printout into several pages by setting an appropriate scale factor in a “Junction Tree” tab in the print dialog.
The magnification glass buttons offer possibilities to zoom in and out for better viewing.
The button with the  symbol offers a possibility to select a different clique as root of the tree. The functionality gets enabled only when exactly one clique is selected. Selecting a different clique as root can be useful in the investigation of local conflicts.
The button with the  symbol gets enabled when the global conflict measure is positive. See the data conflict analysis for details.
The button with the  symbol provides the usual sum propagation functionality.
The button with the  symbol activates a help page providing much the same information as provided in this and the data conflict analysis section.
Evidence is indicated by highlighting evidence nodes (the color of their node symbols are changed to the evidence color). Two different modes exist for displaying evidence nodes. Either all instances of the evidence nodes will be highlighted or only those instances that appear in the cliques where the evidence has been entered. (Note that a node can be a member of several cliques.) A pull-down menu (see above) is provided for selection of preferred display mode.