Color Chart
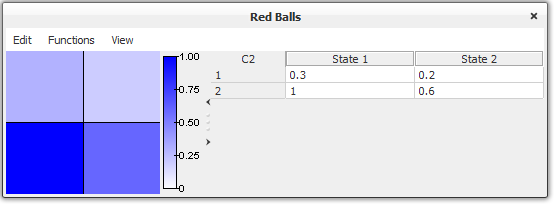
The purpose of the color chart is to graphically display the contents of an entire table at once. This will easily reviel to the user where large values are concentrated. Color charts are used various places in HUGIN for displaying different kinds of information:
In conjunction with the table pane for displaying the CPT. (See figure 1.)
In the Correlation analysis tool.
Figure 1 shows the Tables Pane for a discrete chance node in conjunction with a color chart.

Figure 1: Color chart from the Tables Pane.
