Data Classifier Performance
The data classifier performance analysis tool computes ROC curves for binary classifiers and confusion matrix for binary and multi class classifiers based on values in the data set. The data classifier performance tool is available for the data matrix.
Requirements and Assumptions
Requirement
Classifier performance tool require that probabillities be pre-computed and present in data set - batch propagation feature of the data frame can be used to pre-compute required beliefs before running classifier performance analysis.
Assumptions about data
It is assumed that the beliefs present in the data are pre-computed by propagating in a network where the actual value of the target class has been held back.
Tips for pre-computing beliefs using the batch propagation feature:
To hold back evidence on the target node: rename the column name to something different than the target node (e.g. prepend an underscore symbol ‘_’) and then perform batch propagation.
ROC Curve
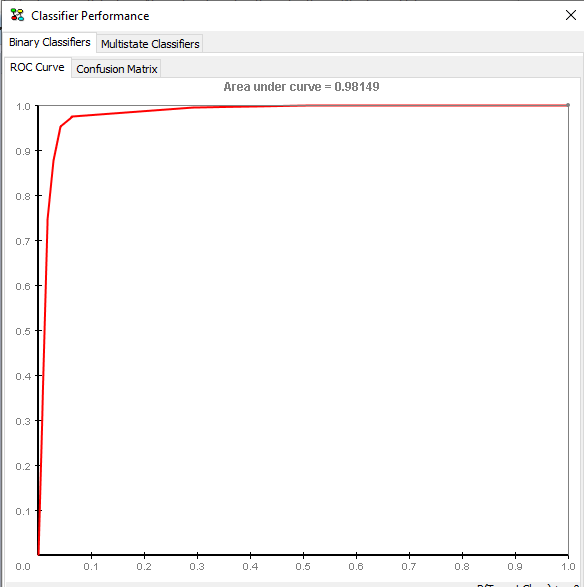
The ROC curve lets you inspect the performance of a given variable as a binary classifier for the data set.

Figure 1: ROC curve
X-axis is the false positive rate, and the Y-axis is the true positive rate.
The ROC curve is based on the performance for predicting specific states.
The area under the curve can be used as a measure for the “goodness” of the network as a classifier for the given variable.
Click a point on the ROC curve to inspect the corresponding predictor threshold.
Confusion Matrix
A confusion matrix can be computed for binary and multi class classifiers.
Binary Classifier Confusion Matrix
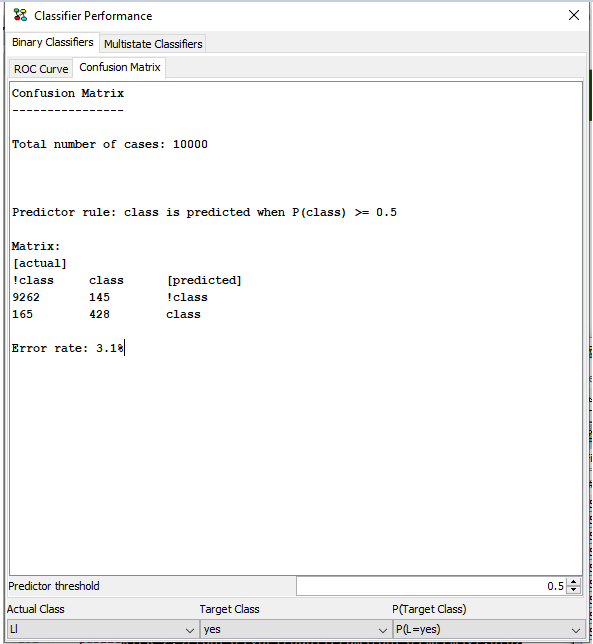
A Binary confusion matrix can be computed based on a specific predictor threshold. The confusion matrix shows how well a given variable performs as a predictor of the actual class.

Figure 2: Confusion matrix
The matrix is constructed like this:

And finally the error rate is reported. It is a measure of the number of false classifications over number of true classifications.
Change the value in the threshold input box to inspect the corresponding confusion matrix.
Multi-State Classifier Confusion Matrix
A Confusion Matrix for Multistate classifiers can be calculated under the Multistate Classifiers tab.
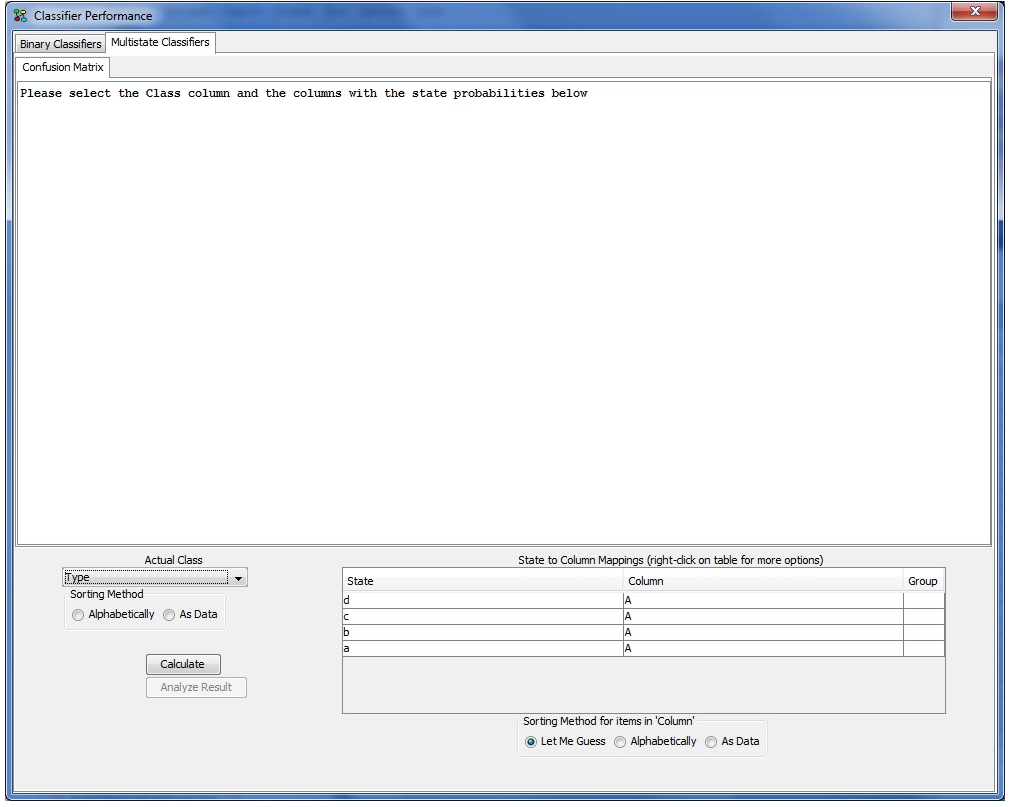
As Actual Class select the name of the column containing the target class labels. Individual cases as well as Sequences can be classified. To classify sequences, make sure that a column has been marked as sequence identifier. When a column is selected under ‘Actual Class’, the table ‘State to Column Mappings’ is polulated with a row for each possible state. Each row int the table is a mapping from a state in the ‘Actual Class’ table to a column of probabilities in the data set (See Figure 3). As indicated in the parentheses a right-click menu is available. Additional mappings can be created if mappings are needed for states not observed in the ‘True Class’ column. Different options are available for sorting alloing convenient selection of the ‘Actual Class’ and State-Column mapping. In Sequence mode (A column has been labeled as sequence identifier) a Sequence Classification method can be configured. There are two sequence classification methods available. The simplest method assigns the entire sequence to the class that obtained the highest probability. The second classification method assigns the sequence Si to class C if the P(C|Si) > t for some threshold t. That means that with this setting a sequence can potentially be assigned to multiple classes which will be reflected and summarized in the confusion matrix.

Figure 3: Multistate Confusion matrix.
Click ‘Calculate’ to calculate the the Confusion matrix. Once the confusion matrix has been calculated, it is possible to look further at the classification result by clicking ‘Analyze Result’. This will open a new window displaying in details which class each case or sequence was assigned to in the calculation.
