Constraints
We consider three different types of query constraints; a single event constraint \(P(y_1| \varepsilon\)), a two events difference constraint \(P(y_1| \varepsilon\))) - \(P(y_2| \varepsilon\)) and a two events ratio constraint \(P(y1| \varepsilon\)) / \(P(y_2| \varepsilon\)). For each type of constraint, we may consider =, <= and >= relations compared to a value x \(\in\) R. We assume the constants of the sensitivity functions involved have been identified such that: \(f(t) = \alpha * t + \beta / \gamma * t + \delta\) and the evidence set \(\varepsilon\) to be constant.
To identify the required adjustment for the parameter t to satisfy a constraint, we solve three equations with respect to equality:
Single event constraint : \(x = P(y_1|\varepsilon)\).
Two events difference constraint : \(x = P(y_1|\varepsilon) - P(y_2|\varepsilon) = (\alpha_1 * t + \beta_1 / \gamma * t + \delta) - (\alpha_2 * t + \beta_2 / \gamma * t + \delta)\).
Two events ratio constraint : \(x = P(y_1|\varepsilon) / P(y_2|\varepsilon) = (\alpha_1 * t + \beta_1 / \gamma * t + \delta) / (\alpha_2 * t + \beta_2 / \gamma * t + \delta)\).
Constraints Panel
Part of the Parameter Sensitivity Wizard is the Query Constraints Panel. The purpose of this panel is to offer the user the ability to specify constraints on the posterior probability in the hypothesis and find the smallest change necessary to satisfy it. In Figure 1 the “asia_.net” network is loaded and a constraint is specified for the posterior probability of “Has tuberculosis”. The current belief for Has tuberculosis = yes is 0.1 and we would like it to be 0.11. After pressing the “Compute” button the tool returns a list of changes that could be made to satisfy the constraint. When selecting one of these suggestions, the buttons “Edit” and “Adopt” become enabled allowing the user to apply the changes.
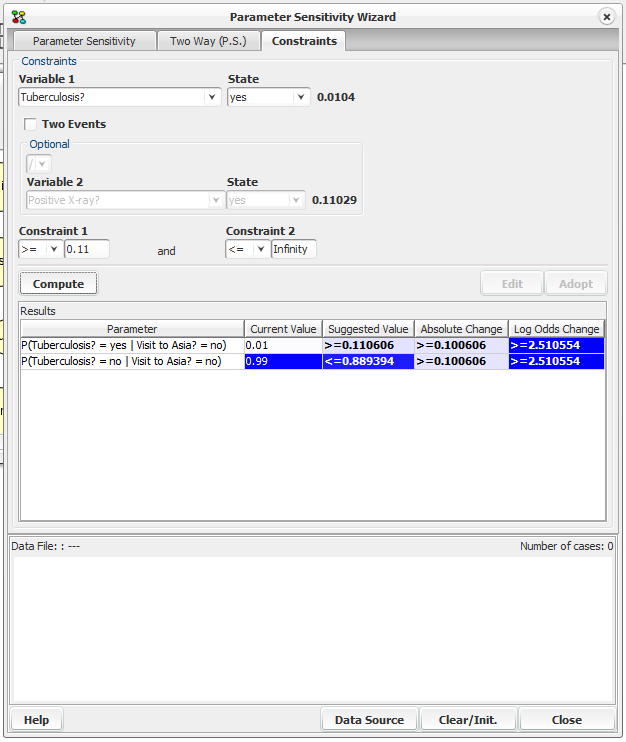
Figure 1: Constraints Panel
The constraints panel consists of the following elements:
The input panel is where the user can select the hypothesis nodes and their states and specify constraints to their posterior probabilities.
The results table is a list of suggested changes to values in CPT tables, that the tool has computed and can satisfy the constraints.
The cases panel is where the user can load a case file corresponding to the current domain, and select and insert a case in the domain.
Input Panel
There are three ways to specify constraints in the input panel; one event constraint, two event Ratio constraints and two event difference constraints. To specify a one event constraint, select a hypothesis node from the “Variable 1” combo box and then one of its states from the state combo box. The belief for the selected state is shown to the right.
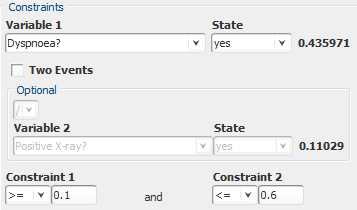
Figure 2: The input panel where one event constraint is specified.
To specify two event constraints the “Two Events” check box should be selected. The optional panel becomes enabled and allows the selection of the type of the two event constraint (ratio or difference) and the selection of the second Hypothesis node (Variable 2). The next step is to input the constraints in the constraint fields (Constraint 1, Constraint2). It is possible to specify one or two constraints (“<= con1 and >= con2”). When specifying one constraint the Constraint 2 field is automatically set to Infinity (Figure 3) or -Infinity (Figure 4) according to comparison symbol selected in the Constraint 1 combo box.
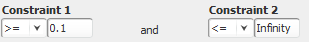
Figure 3: One constraint, greater equal
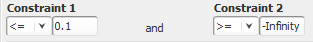
Figure 4: One Constraint, less equal
The computation of the suggested changes that could be made to satisfy the specified constraints, is triggered by pressing the “Compute” button or pressing Enter, while editing in one of the two constraint fields.
Results Table
The results table (Figure 5) displays suggested changes that can be made to certain cpt tables to satisfy the constraints. Each row describes one suggestion with the following columns:
The Parameter column describes the posterior probability that needs to be changed.
The current value is the value of the cpt index.
The suggested value column shows a range of values that can replace the current value in order for the constraints to be satisfied. The value displayed in bold, indicates the smallest absolute change within the suggested values range.
The absolute change is a range of values that represent the absolute difference between the suggested value and the current value. ( Current - suggested ). The value displayed in bold represents the absolute change for the suggested value displayed in bold.
If q is the new value and p is the current value, the Log Odds Change is defined as follows: \(log(q/(1-q)) - log(p/(1-p))\). The value displayed in bold, indicates the smallest log odds change within the suggested values range.
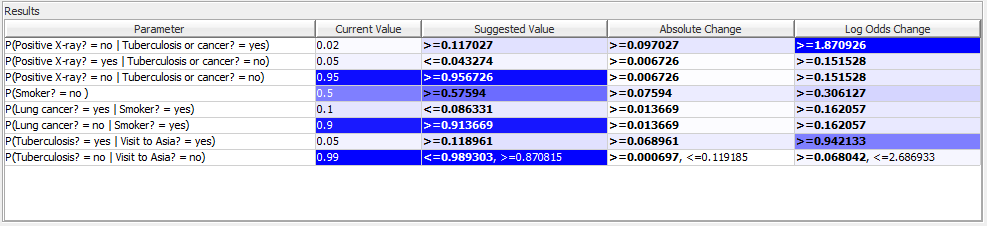
Figure 5: A table showing the suggested changes that could satisfy the constraints
Every column can be sorted by clicking on its header once (ascending order) or twice (descending order). Every cell in a column other than the Parameter column, is colored with a variation of the blue color that represents the actual value. In case of a range of values, the color represents the one displayed in bold. The color variation and the sorting function make it easier to select the suggested change with the smallest absolute or log odds change. When selecting a row, the “Edit” and “Adopt” buttons are enabled (Figure 6).

Figure 6: “Edit” and “Adopt” buttons
When pressing “Edit” a dialog with the selected cpt table is displayed allowing the user to manually apply the change selected in the results table. If the first row in the results table is selected the dialog in Figure 7 is displayed and the user can change the value 0.3 (smoker = no) to a value between 0.39907 and 0.708908.
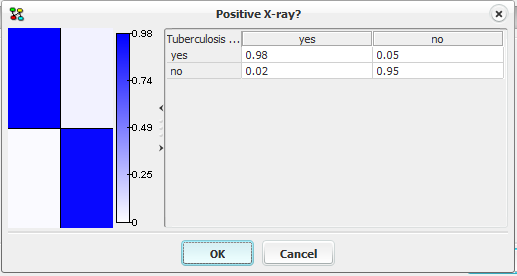
Figure 7: CPT for “Has bronchitis”
When pressing “Adopt”, the selected change is automatically applied and the value displayed in bold is used as it represents the smallest change. After applying constraints in the domain the effects of the changes made can be seen in the “Parameter Sensitivity Panel”.