Value of Information Analysis
Value of information analysis may be performed in both (limited memory) influence diagrams and Bayesian networks. The approach to value of information analysis in (limited memory) influence diagrams is, however, slightly different from the approach to value of information analysis in Bayesian networks. Thus, in the following two sections we consider in turn value of information analysis in (limited memory) influence diagrams and Bayesian networks, respectively. Each of the following two sections is self contained. This implies that each section may be read separately, but it also implies that some overlap may be present.
Limited Memory Influence Diagrams
Consider the situation where a decision maker has to make a decision given a set of observations. It could, for instance, be a physician deciding on a treatment of a patient given observations on symptoms and risk factors related to a specific disease. The decision could, for instance, be whether or not to operate the patient immediately. Prior to making the decision, the physician may have the option to gather additional information about the patient such as waiting for the result of a test or asking further questions. Given a range of options, which option should the physician choose next? That is, which of the given options will produce the most information? These questions can be answered by a value of information analysis.
Given a (limited memory) influence diagram model, a decision variable, and observations on the informational parents of the decision, the task is to identify the variable, which is most informative with respect to the decision variable.
We consider one step lookahead hypothesis driven value of information analysis on discrete random variables relative to discrete decision variables. The functionality is enabled when a discrete decision node is selected or when pressing the right mouse button on a discrete decision node in the Node List Pane.
Maximum Expected Utility
The main reason for acquiring additional information is to increase the maximum expected utility of the decision under consideration. The selection of the variable to observe next (e.g. the question to ask next) is based on the principle of maximizing expected utility. Expected utility is a measure of the usefulness of the decision options associated with the decision variable.
Value of Information Analysis
The value of information is a core element of decision analysis. We perform decision analysis using limited memory influence diagram representations of decision problems. The structure of an influence diagram specify a partial order on observations relative to a partial order on decisions. Value of information analysis in limited memory influence diagrams considers the impact of changing the partial order of observations relative to a decision. Assume D is the next decision to be considered and let \(\varepsilon\) be the set of observations and decisions made up to decision D. Initially, the basis for making decision D is the expected utility function EU(D| \(\varepsilon\)) over the options encoded by D.
Assume Xi = x is observed prior to making decision D. The revised basis for making decision D is the now expected utility function EU(D| \(\varepsilon\),x):
Prior to observing the state of Xi the probability distribution of Xi is P(Xi | \(\varepsilon\)). Thus, we can compute the expected utility of the optimal decision at D after Xi is observed EUO(Xi, D| \(\varepsilon\)) to be:
This number should be compared with the maximum expected utility of the optimal decision at D without the observation on Xi. The value VOI(Xi,D| \(\varepsilon\)) of observing Xi before decision D is:
Performing Value of Information Analysis
Value of information analysis on a selected decision variable can be activated from either the Network Menu, Node List Pane, or by clicking the right mouse button. Notice that the decision variable must be selected in order to activate value of information analysis.
Value of information analysis is supported for discrete chance variables relative to discrete chance variables.
Figure 1 shows the value of information pane appearing after activating value of information analysis on Drill. In this pane the results of the value information analysis is shown (Figure 3) and the set of information variables can be defined (Figure 2).
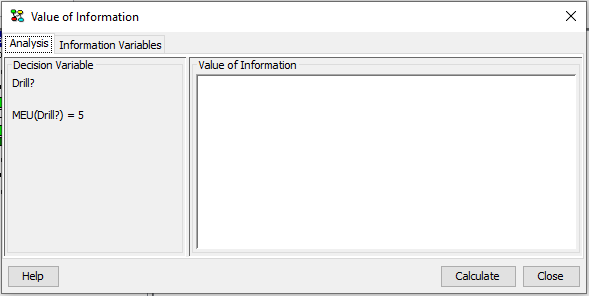
Figure 1: The maximum expected utility of the decision variable Drill is MEU(Drill)=5.
Figure 1 shows that the maximum expected utility of the decision variable Drill is MEU(Drill)=5.
Value of information analysis on a decision variable is performed relative to a set of information variables. The set of information variables can be selected as indicated in Figure 2.
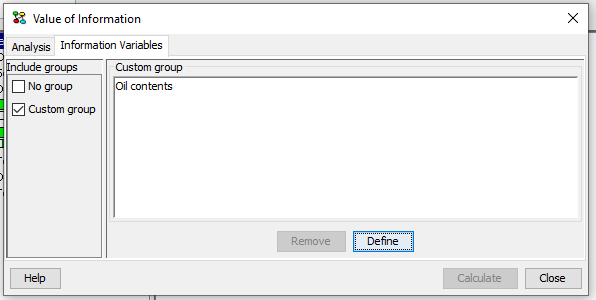
Figure 2: Selecting the set of information variables.
Selecting information variables proceeds in the same way as selecting Target(s) of Instantiations in the d-Separation pane.
For the custom group we restrict the set of possible information variables not to include descendants of the decision, descendants of subsequent decisions, informational parents of the decision, or informational parents of preceding decisions.
After selecting the set of information variables the value of information analysis can be performed by pressing Calculate. The results for the example are shown below in Figure 3.
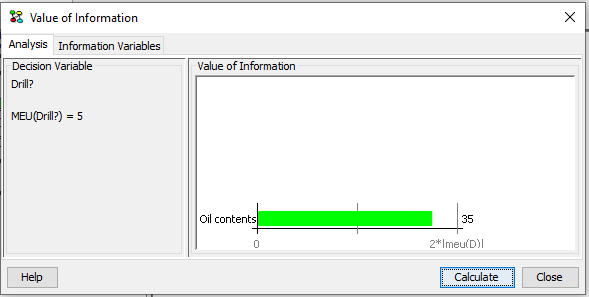
Figure 3: The results of value of information analysis on Drill relative to the selected set of information variables.
The results show the value of information of each of the selected information variables relative to the decision. There is one bar for each information variable. The name of the information variable and the value of information of the information variable relative to the decision is associated with each bar. The size of the bar is proportional to a multiplum of the maximum expected utility of the decision.
The value displayed for each observation node is the difference between the maximum expected utility of the decision node with and without the node observed before the decision.
Bayesian Networks
Consider the situation where a decision maker has to make a decision based on the probability distribution of a hypothesis variable. It could, for instance, be a physician deciding on a treatment of a patient given the probability distribution of a disease variable. For instance, if the probability of the patient suffering from the disease is above a certain threshold, then the patient should be treated immediately. Prior to deciding on a treatment the physician may have the option to gather additional information about the patient such as performing a test or asking a certain question. Given a range of options, which option should the physician choose next? That is, which of the given options will produce the most information? These questions can be answered by a value of information analysis.
Given a Bayesian network model and a hypothesis variable, the task is to identify the variable, which is most informative with respect to the hypothesis variable.
We consider myopic hypothesis driven value of information analysis on discrete random variables relative to discrete random variables. The functionality is enabled when a discrete chance node is selected or when pressing the right mouse button on a discrete chance node in the Node List Pane.
Entropy and Mutual Information
The main reason for acquiring additional information is to decrease the uncertainty about the hypothesis under consideration. The selection of the variable to observe next (e.g. the question to ask next) can be based on the notion of entropy. Entropy is a measure of how much probability mass is scattered around on the states of a variable (the degree of chaos in the distribution of the variable). Entropy is a measure of randomness. The more random a variable is, the higher its entropy will be.
Let X be a discrete random variable with n states x1,…,xn and probability distribution P(X), then the entropy of X is defined as:
The maximum entropy, log(n), is achieved when the probability distribution, P(X), is uniform while the minimum entropy, 0, is achieved when all the probability mass is located on a single state. Thus, the value of H(X) is in the range [0,log(n)].
Since entropy can be used as a measure of the uncertainty in the distribution of a variable, we can determine how the entropy of a variable changes as observations are made. In particular, we can identify the most informative observation.
If Y is a random variable, then the entropy of X given an observation on Y is:
where I(X,Y) is the mutual information (also known as cross entropy) of X and Y. The conditional entropy H(X| Y) is a measure of the uncertainty of X given an observation on Y, while the mutual information I(X,Y) is a measure of the information shared by X and Y (i.e. the reduction in entropy from observing Y). If X is the variable of interest, then I(X,Y) is a measure of the value of observing Y. The mutual information is computed as:
In principle, I(X,Y) is a measure of the distance between P(X)P(Y) and P(X,Y). The conditional mutual information given a set of evidence \(\varepsilon\) is computed by conditioning the probability distributions on the available evidence \(\varepsilon\):
Thus, we compute I(X,Y) for each possible observation Y. The next variable to observe is selected as the variable Y, which has the highest non-zero mutual information with X, i.e. I(X,Y), if any.
Value of Information Analysis
Value of information analysis is the task of identifying the values of pieces of information. When considering hypothesis driven value of information analysis in Bayesian networks, we need to define a value function in order to determine the value of an information scenario. Entropy can be used as a value function.
In a hypothesis driven value of information analysis the value of an information scenario is defined in terms of the probability distribution of the hypothesis variable. If T is the hypothesis variable, then the value function is defined as:
The reason for using the negation of the entropy is best illustrated using an example. Consider a binary hypothesis variable T with states false and true. Hence, the distribution of T is fully specified by a single parameter p, i.e. P(T)=(false,true)=(p,1-p). Figure 4 illustrates the entropy as a function of p while Figure 5 illustrates the negation of the entropy as a function of p.
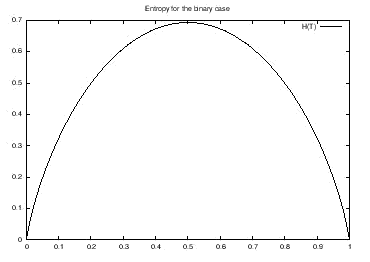
Figure 4: The entropy of T.
As can be seen from Figure 4 the entropy takes on its maximum value for the uniform distribution and its minimum value for the extreme cases (p=0 and p=1). Since the value function should take on its maximum value at the extreme cases and the minimum value in the uniform case, the negation of the entropy is used as the value function as illustrated in Figure 5.
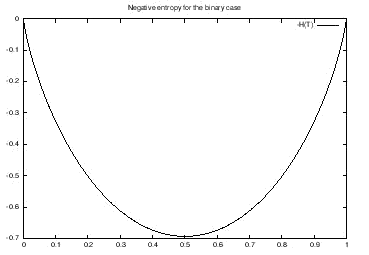
Figure 5: The negation of the entropy of T.
The value of the information scenario after observing a variable X is:
Thus, myopic hypothesis driven value of information analysis in Bayesian networks amounts to computing the value of the initial information scenario V(H) and the value of information scenarios where a variable X is observed, i.e. V(H| X). The task is to identify the variable, which increase the value of information the most. The most informative variable to observe is the variable with the highest mutual information with the hypothesis variable.
Performing Value of Information Analysis
Value of information analysis on a selected hypothesis variable can be activated from either the Network Menu, Node List Pane, or by clicking the right mouse button. Notice that the hypothesis variable must be selected in order to activate value of information analysis.
Value of information analysis is supported for discrete chance variables relative to discrete chance variables.
Figure 6 shows the value of information pane appearing after activating value of information analysis on B. In this pane the results of the value information analysis is shown (Figure 8) and the set of information variables can be defined (Figure 7).
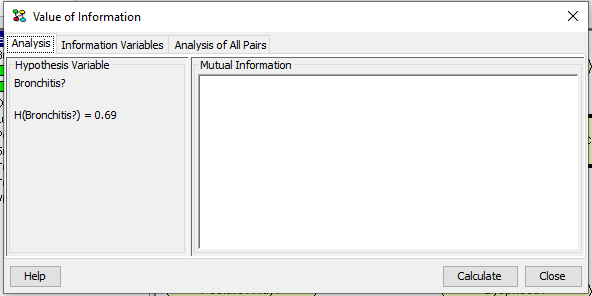
Figure 6: The entropy of the hypothesis variable B is H(B)=0.69.
Figure 6 shows that the entropy of B is H(B)=0.69.
Value of information analysis on a hypothesis variable is performed relative to a set of information variables. The set of information variables can be selected as indicated in Figure 7.
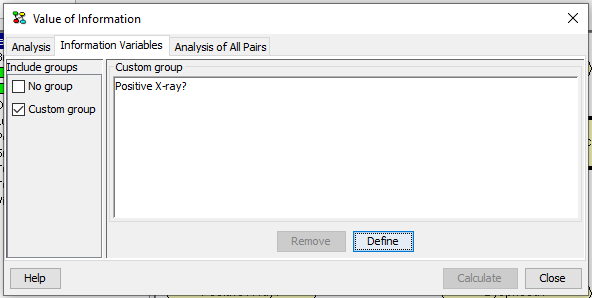
Figure 7: Selecting the set of information variables.
Selecting information variables proceeds in the same way as selecting Target(s) of Instantiations in the d-Separation pane.
After selecting the set of information variables the value of information analysis can be performed by pressing Calculate. The results for the example are shown below in Figure 8.
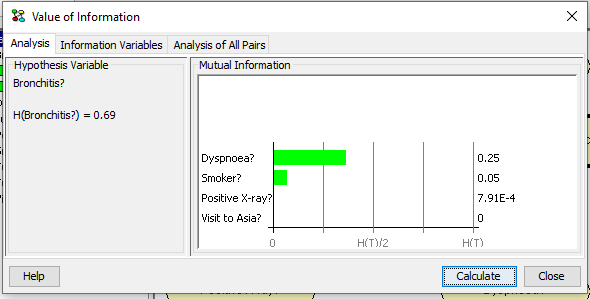
Figure 8: The results of value of information analysis on B relative to the selected set of information variables.
The results show the mutual information I(T,H) between the target node and each of the selected information variables. There is one bar for each information variable. The name of the information variable and the mutual information between the target node and the information variable are associated with each bar. The size of the bar is proportional to the ratio between the mutual information and the entropy of the target node.
The examples above consider the case of discrete observation nodes. For possible observations on continuous chance nodes an approximation is used. Instead of using the true mixture of Normal distributions for a continuous node, a single Normal distribution with the same mean and variance is used as an approximation.
Mutual Information for All Pairs
In order to compare the strengths of dependency between different pairs of variables, a normalized variant of the mutual information can be used:
Notice that this measure is symmetric in X and Y. After selecting the set of information variables the value of information analysis can be performed by pressing Calculate. The results for the example are shown below in Figure 9.
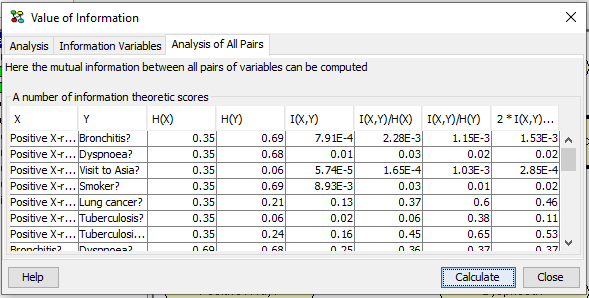
Figure 9: the results of an Analysis of All Paris calculation.