Adaptation Wizard
The Adaptation Wizard is a tool for performing batch adaptation on a network using any number of case and data files. The Adaptation Wizard can be activated by selecting “Adaptation Wizard” in the Wizards Menu. Note that the wizard is only available in run mode, and for flat networks with discrete chance nodes.
Step 1: Select data sources and configure tables
On the Data pane a set of case and/or data files can be added. The data sources will be used for adaptation in the order that they are added. The Data pane is displayed in figure 1.
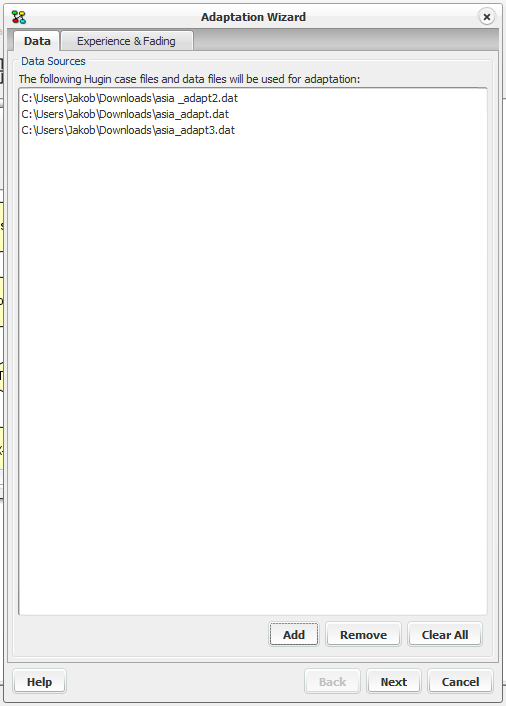
Figure 1: Selecting data sources.
On the Experience and Fading pane, experience and fading tables may be configured for each node. The experience count and fading factors are configured in these tables. Adaptation will only be performed for conditional distributions of discrete chance nodes corresponding to parent configurations with a positive experience count.
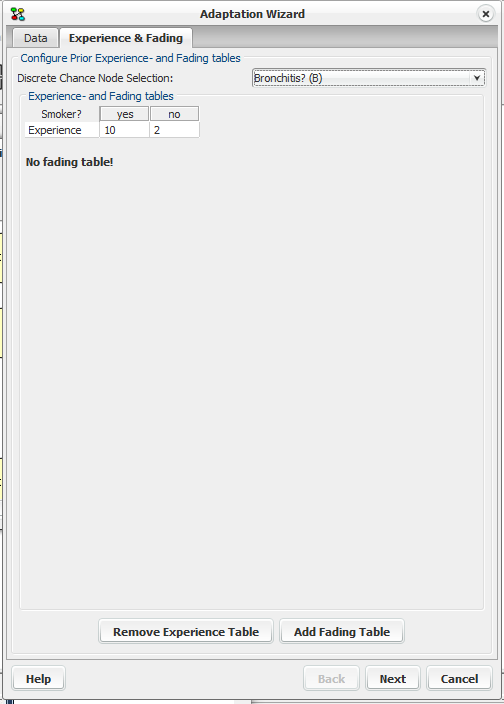
Figure 2: Configuring experience- and fading tables.
When the data sources, experience tables and fading tables have been configured, press the ‘next’ button.
Step 2: Review configuration
The dialog (figure 3) will let you review the configuration of the wizard. The recording options configures any information that the wizard should record and plot during adaptation. The dialog also displays a list with the nodes that will be subject to adaptation. When you are done press the ‘next’ button.

Figure 3: Reviewing configuration, selection of information to be recorded.
Step 3: Perform adaptation
Figure 4 + 5 show the final dialog of the adaptation wizard. The batch adaptation process can be controlled using the buttons. Adaptation is started by pressing the button ‘Adapt’, and may be paused with ‘Break’. The dialog may have a number of panes (Experience Counts, figure 4; Marginals, figure 5) depending on the configuration specified for the recording options. In both panes the X-axis represent the cases, and the Y-axis represent experience count or posterior marginals.
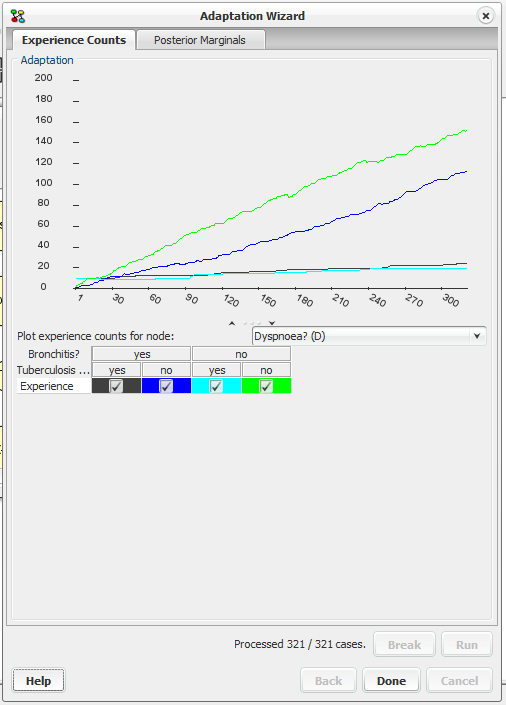
Figure 4: Experience counts.
From the Experience Counts pane (figure 4), it is possible to inspect the development of the experience counts for a node. The node can be selected from the dropdown list, and the exact configuration can be selected by clicking in the ‘Experience’ checkboxes. To make it easier to distinguish the different configurations, each is plotted in distinct colors.
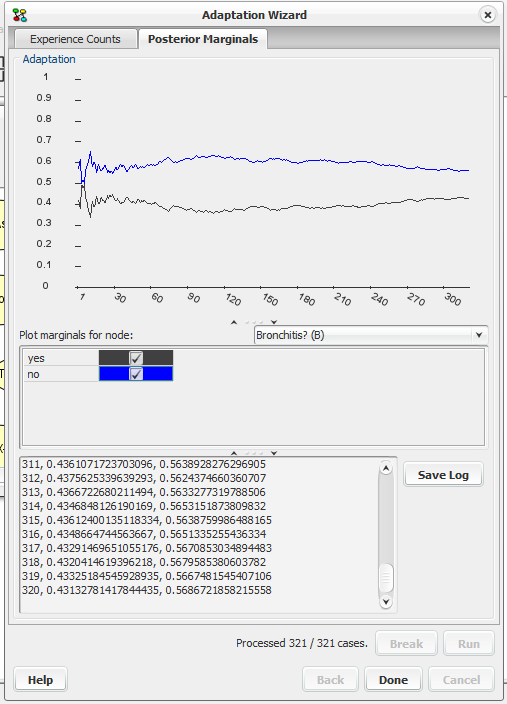
Figure 5: Posterior marginals.
From the Posterior Marginals pane (figure 5), the development of the posterior marginals of a node may be inspected. The posterior marginals for the exact states to plot can be selected by clicking in the checkboxes next to the states. The logged data can be saved to file by clicking on the Save Log button.