Hidden Node Analyzer
The Hidden Node Analyzer is a wizard for determining the best number of states of a (hidden) discrete chance node in a Bayesian network from a dataset. The Hidden Node Analyzer has three steps:
loading a data file
selecting the hidden node and setting the parameters for identification of the number of states of the hidden node
the analysis
Each step is described in the following sections.
Load Data File
To perform any analysis the wizard will first need a set of cases. Cases can be imported by loading a HUGIN data file or connecting to a database service and import. Click on button “Data Source” to import data.
After importing a set of cases, the Data Source pane will display a table with the imported cases, see Figure 1. To discard all imported cases click on the button “Clear Data”.
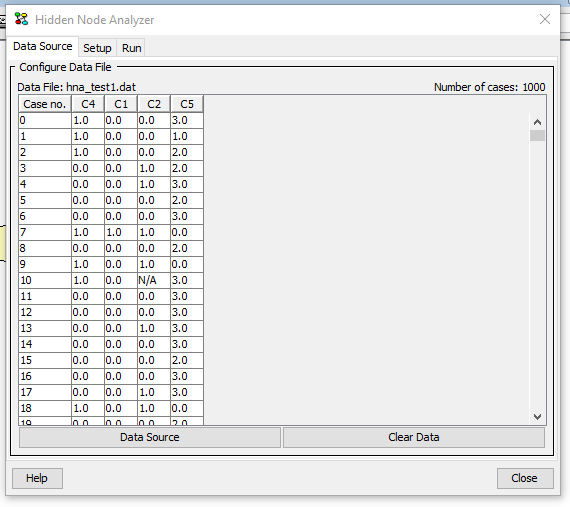
Figure 1: Data Source pane. A set of cases has been imported.
Setting Parameters
The Hidden Node Analyzer can be used to identify the number of states of a hidden node. A node is hidden if no case in the dataset contains an observation on the node.
To identify the number of states of a hidden node, the user should specify the hidden node, the minimum number of states, the maximum number of states, and whether the conditional probability table (CPT) of the hidden node should be randomized (default option) as illustrated in Figure 2.
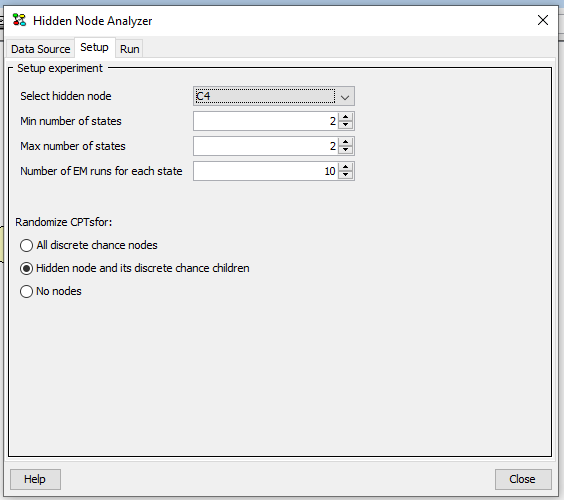
Figure 2: Setup pane.
The Hidden Node Analyzer supports discrete chance nodes only and only if there are atleast one non-boolean node.
Analysis
The Hidden Node Analyzer iterates over the possible state space sizes of the hidden from minimum to maximum as selected by the user. In each iteration an EM learning operation is performed from the initial network, i.e., the state of the network when the wizard was opened. The conditional probability table of the hidden node is randomized, if the user has selected this option (default). For each iteration the AIC, BIC and log-likelihood are displayed to the user.
Notice that to perform the analysis, the network must be compiled and one EM learning operation is performed for each state considered. This may result in long running times.
Figure 3 shows the result of running the Hidden Node Analyzer on an example network and dataset.
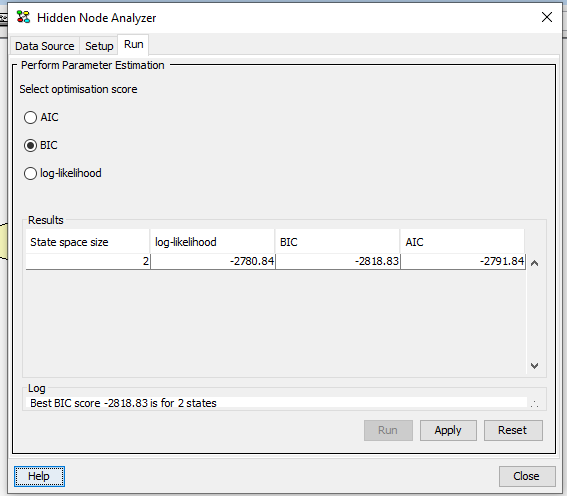
Figure 3: Run pane.
For each possible state space size of the hidden node, the Hidden Node Analyzer reports the value of each optimisation score. For the selected optimisation score, the highest scoring state size space is shown in the last line. This is a help for the user to identify the number of states producing the highest score.
The user can choose to apply the settings associated with the highest scoring state space size. This will update the underlying model including setting the number of states of the hidden node and updating the conditional probability tables et cetera of the nodes in the network from the result of the EM learning iteration producing the highest score. Only conditional probability tables for nodes with experience tables are updated.